There's a question students ask every co-op cycle, usually sometime in November: did I start too late? The answer they usually get is some version of "no, lots of jobs get posted late, keep applying." I wanted to know whether that was actually true. Not in general, in our data, for one full cycle, start to finish.
Co-op, if you haven't read my other posts, is the part of this university's model where students leave campus and work a real job for six months. Getting one works like a small job market that opens and closes a few times a year. Employers post openings, students apply, some postings end in a hire and some quietly close unfilled, and some students stop searching, sometimes because they got something and sometimes because they gave up. It's a market with a start date and an end date, which makes it unusually clean to study.
My first instinct, and I think a lot of people's first instinct right now, was that this was a modeling problem. Predict which postings fill. Predict which students get placed. Throw features at it and see what comes out. I'm glad I didn't start there, because the thing that actually unlocked this was boring data engineering, and the thing that answered the question was arithmetic.
The boring part first. The raw data lives in a few places that don't agree on what time it is. Postings have a posted date and a close date. Applications have a submitted date. Placements have an approval date that can land weeks after the student actually accepted. Students don't have a "searching" status at all, you have to infer it from activity. So the first real piece of work was building one weekly grain for the whole cycle: for every week, how many openings were live, how many were newly posted, how many students were actively searching, how many had been placed, and how many had gone quiet. Week one is the week applications open. Everything gets bucketed relative to that, so two cycles in different years can sit side by side.
That sounds trivial. It's most of the work. "Actively searching" is the best example, because there's more than one reasonable definition and they tell very different stories. Count anyone who has ever applied, and the searching population only ever grows, so nobody ever leaves the market. Count anyone who applied that week, and the market looks like it empties every weekend. What you actually want is a student counted as searching from their first application until they're placed or they stop searching, with that stop recorded in the week it happens. That last part matters, because "gave up" is one of the most important outcomes in the whole cycle, and it's easy to lose it entirely if your definition of searching is sloppy.
-- one row per student per week: searching from first application
-- until they're placed or they stop, recorded in the week it happens
with first_app as (
    select student_id, min(week_num) as start_week
    from applications
    group by student_id
),
exits as (
    select student_id, coalesce(placed_week, stopped_week) as end_week
    from search_outcomes
)
select
    w.week_num,
    count(distinct f.student_id) as students_searching
from cycle_weeks w
join first_app f
  on f.start_week <= w.week_num
left join exits e
  on e.student_id = f.student_id
where e.end_week is null or e.end_week > w.week_num
group by w.week_num
order by w.week_num
Once the grain existed, the shape of the cycle came out almost immediately, and it wasn't the shape the usual advice assumes.
Students arrive early. By the time weekly search activity peaks, around week seven, roughly nine in ten students who will ever search this cycle have already sent at least one application. The rest of the cycle isn't new people showing up. It's the same people leaving, either hired or worn out. Half the searching students are placed by about week eleven. After that the placement curve flattens hard, and the share of students who have simply stopped searching roughly triples over the following weeks. Past the middle of the cycle, a student still searching is more likely to leave by giving up than by getting hired.
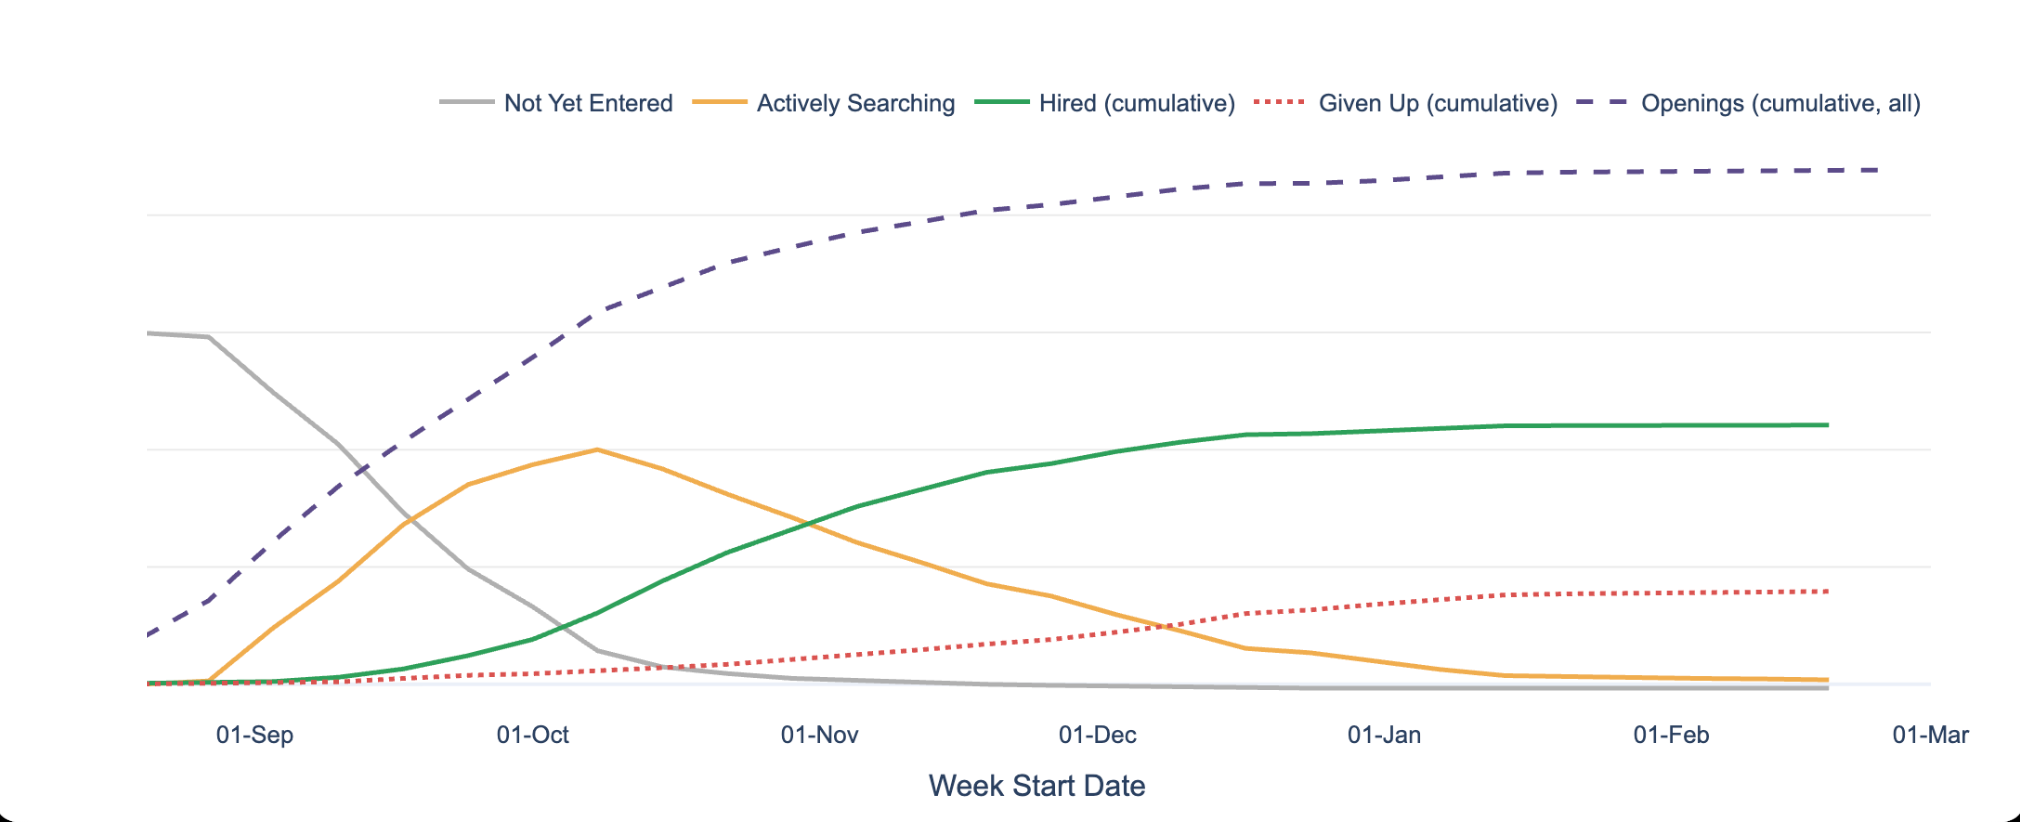
The real cycle, with the counts taken off. Grey is students who haven't entered yet, orange is actively searching, green is hired, red dotted is given up, and the dashed line is openings. Everything interesting happens between September and early November.
Supply behaves differently from demand, and that was the part I found most useful to show people. Openings peak around week two, right as applications open, before most students have really started. Half of all postings are live a couple of weeks before student activity peaks. And there's no second wave. Supply comes in early, once, and then declines, while demand is still climbing. For most of the cycle there are more openings than active searchers, so the problem isn't that there aren't enough jobs on paper. It's that the jobs and the students aren't in the market at the same time in the same shape.
Illustrative shape with made-up values, both lines scaled to their own peak. Supply arrives early, once. Demand peaks weeks later, and there's no second wave of postings to meet it.
Then the question I actually came for: does posting late, or applying late, hurt your chances? This is where I'd planned to build a model, and where I ended up not needing one. The fill rate for a posting, the share that close with a hire, sat in the same band whether the posting went up early or mid-cycle. There's an apparent spike for postings in the last few weeks, and it's exactly the kind of thing that ends up in a slide as a finding. It's a handful of postings. Small denominators make dramatic percentages. Timing, on its own, didn't predict whether a posting filled.
Two things did. How many applications a posting received, which is almost circular but still worth quantifying, because postings under a certain application count went unfilled at close to twice the rate of the busy ones. And the employer's track record. Employers with a history of filling their co-op roles filled new ones at a meaningfully higher rate than employers who historically struggled, and that effect held up independent of application volume. It was the strongest single signal in the data.
| Employer history | Under the application cutoff | Over it |
|---|---|---|
| Reliable filler | ~60% filled | ~78% filled |
| Historically struggles | ~40% filled | ~62% filled |
Made-up numbers, real direction. Both effects stack, and history matters even when volume is held steady.
I could have fed all of that into a gradient-boosted model, gotten a nice score, and shipped a feature importance chart with employer history at the top. It would have told us the same thing, less clearly, and with an extra layer nobody on the co-op team could check by hand. A two-way table of fill rate by employer history and application volume told the story, fit on one slide, and anyone could re-derive it with a pivot table. The model would have been more impressive and less useful.
That's the thing I keep taking away from projects like this, especially now that every analytics problem gets pitched as an AI problem first. Most of the value was in deciding what a week is, what "searching" means, and when a student has actually left the market. That's data engineering. The analysis on top was grouping and dividing. If you reach for a model first, you end up fitting features on top of whatever definition of "searching" you happened to start with, and if that definition is wrong, the model will happily learn the wrong thing with great accuracy.
There are things I'd want a model for next. Which students are at risk of giving up, early enough to reach them before week twelve, is a real prediction problem with a real intervention attached. But that question only became askable once the weekly grain existed and "gave up" had a definition. The model comes last, if it comes at all.
So, to the student asking in November: your application isn't worse because it's late. But the market you're applying into is thinner than it was in October, the employers who reliably hire mostly already have, and the students around you are quietly leaving. That's worth knowing, and it's worth telling people in September instead.