The chart looked fantastic. Spring midterms had just set a record for daily usage of the AI assistant the university had rolled out to everyone, well above the previous peak during fall finals, and the number of conversations per student per day had jumped by something like sixty percent in two months. It was exactly the chart leadership wanted to see. And the first thing I wrote under it, before any of the takeaways, was a note saying we weren't sure it was real yet.
A little background. When a university gives every student, faculty member and staff member access to an AI tool, the question that follows within weeks is some version of "is anyone using this, and is it worth it." My team ended up owning the answer. Which meant building a pipeline for AI usage data, which turned out to be a lot like building a pipeline for anything else, with a few new ways to fool yourself.
The raw material came from two places. The vendor exposes audit logs, which record events like sign-ins, conversations created, projects opened and files uploaded. It also exposes a compliance feed with activity at a different level of detail. Neither one alone told the whole story, and they overlap in ways that are easy to double count. So the pipeline follows the same shape as everything else I build: a staging layer that cleans each source on its own, an intermediate layer that rolls each one up to one row per person per day, and then a single merged daily summary where the two sources are reconciled into one set of activity counts. Everything downstream, adoption, retention, engagement, reads from that one table.
-- one row per person per day, reconciled across both feeds
with audit as (
    select user_id, activity_date,
           count_if(event_type = 'conversation_created') as conversations,
           count_if(event_type = 'project_created')      as projects
    from stg_audit_logs
    group by 1, 2
),
compliance as (
    select user_id, activity_date,
           count(distinct conversation_id) as conversations,
           count(distinct project_id)      as projects
    from stg_compliance_activity
    group by 1, 2
)
select
    coalesce(a.user_id, c.user_id)       as user_id,
    coalesce(a.activity_date,
             c.activity_date)            as activity_date,
    greatest(zeroifnull(a.conversations),
             zeroifnull(c.conversations)) as conversations,
    greatest(zeroifnull(a.projects),
             zeroifnull(c.projects))      as projects
from audit a
full outer join compliance c
  on a.user_id = c.user_id and a.activity_date = c.activity_date
Taking the larger of the two counts rather than adding them is the whole trick. Adding them would double count every day both feeds saw.
Then comes the part that makes usage data actually useful to a university, which is knowing who the users are. A raw log tells you an account did something. It doesn't tell you whether that account belongs to a first-year undergraduate, a PhD student, a faculty member in engineering or someone in the finance office. So the daily summary gets joined to HR and student records to put each person in a segment, and everything personally identifying stops at that join. Past it, people are hashed ids with a role, a college and a level. Nobody reading an adoption report needs to know who, only what kind.
The first honest surprise was how much of the work was definitions. What counts as a user? Someone who signed in once? Someone who had a conversation? The number of people who had ever touched the tool was large and not very meaningful, since a lot of people open anything new once. So we split it: people who had accessed it at all, and people with meaningful continued use, defined as more than a handful of activities. Retention needed its own definition too, rolling seven-day, thirty-day and sixty-day windows, because a "monthly active user" number on its own can't tell a steady habit from a spike.
| Term | What it means here |
|---|---|
| Accessed | Signed in and did anything at all, at least once |
| Meaningful use | More than a handful of activities, not just a first look |
| 7 / 30 / 60 day retention | Of people active in a window, how many are active again in the next one |
| Engagement tier | Where a person sits by activity per day, from trial to power user |
The shape of usage turned out to be the most interesting finding, and it's not something a vendor dashboard shows you. Usage follows the academic week, strong Monday through Thursday and falling off on weekends, which is the signature of a tool being used for coursework rather than curiosity. And it follows the academic calendar. Usage more than doubled during midterms and finals compared to an ordinary week. You can literally see the semester in the line. The other finding people cared about was stickiness. Once someone used it more than a few times, they mostly kept using it. Roughly half of eligible people across students, faculty and staff had tried it, and staff adoption was actually the highest of the three, which surprised a lot of people who assumed this was a student story.
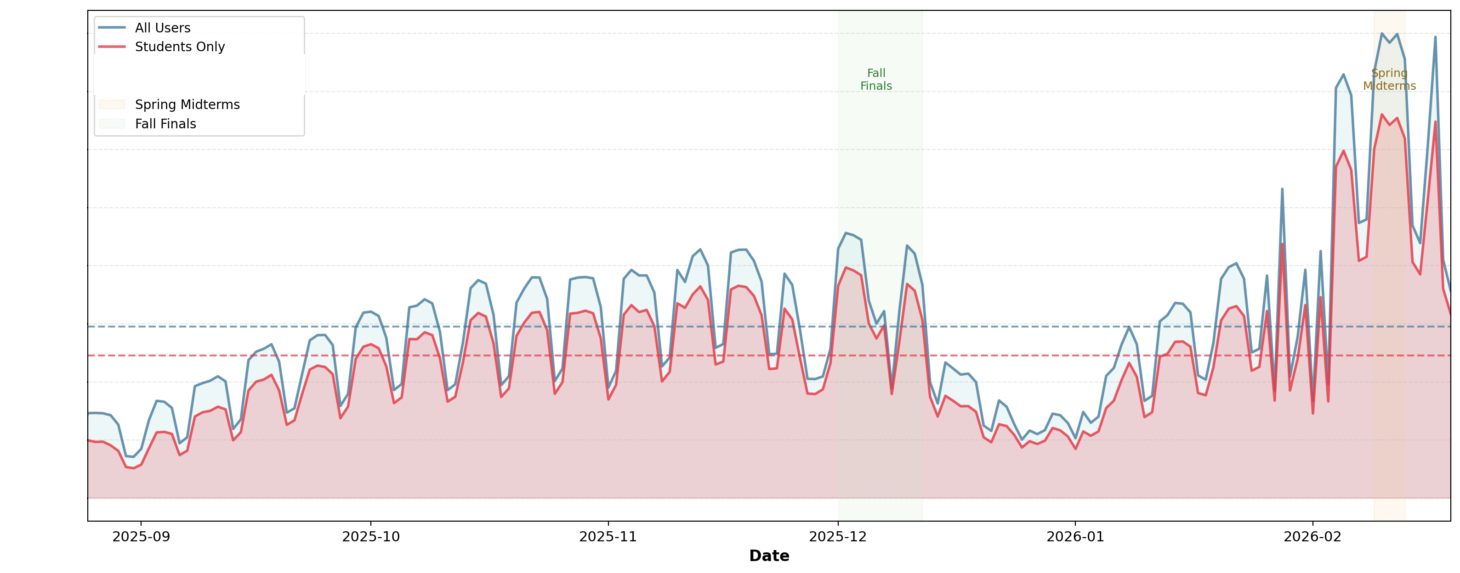
Real shape, counts removed. Blue is everyone, red is students only. The weekly sawtooth is coursework, the shaded bands are fall finals and spring midterms, and the tall spike on the right is the record that needed checking.
Real pattern, shading only. Weekday evenings and nights are the hot zone, Saturday mornings are almost empty. That is what coursework looks like from the outside.
Access method was a fun side quest. The logs carry a user agent string, the little identifier your browser or app sends with every request. Parsing it tells you whether someone used the web app, the desktop app, a phone, or reached the tool through an integration. That matters for things like support and training, and it's the kind of question nobody thinks to ask until the data can answer it.
Which brings me back to the record-breaking midterm chart. When a number jumps that much, there are three possible explanations. People really started using the tool more. The population changed, for example a big new group gained access. Or the way activity gets recorded changed underneath you. That third one is the one AI data makes especially likely right now, because these platforms change constantly. A vendor can change what counts as a conversation, add a feature that creates events in a new way, or change how the compliance feed reports activity, and your pipeline will faithfully record a step change in behavior that never happened.
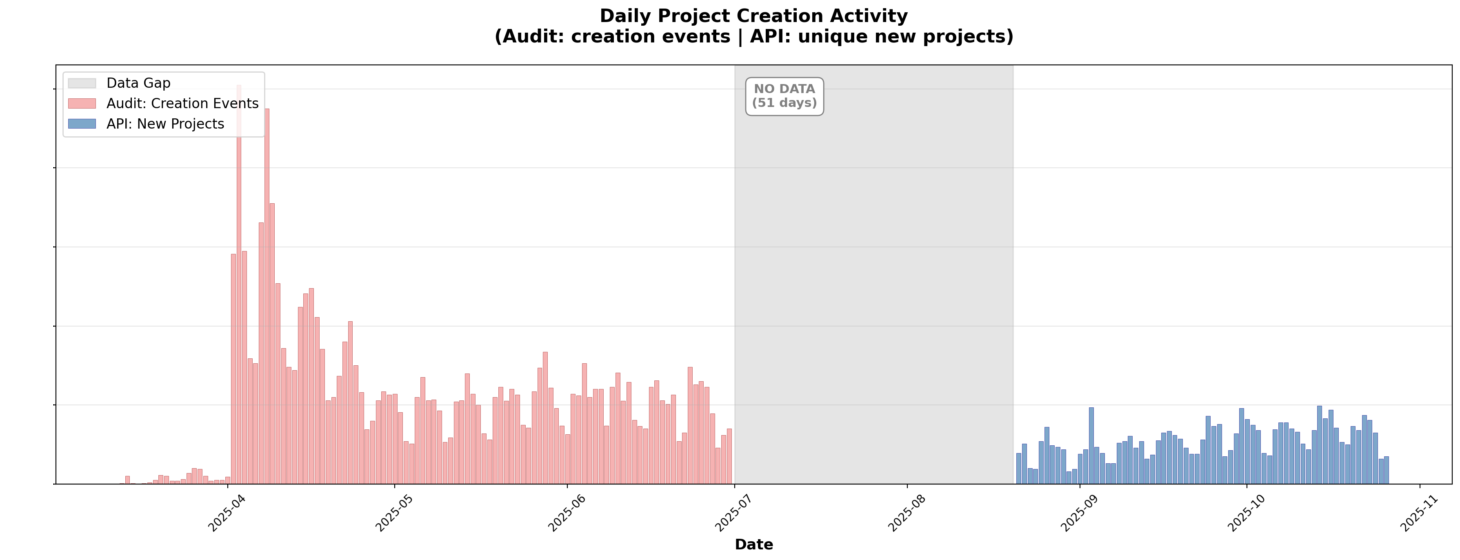
This is the kind of thing I mean. Project creation from the audit logs on the left, a 51-day gap with no data, then the API feed on the right. They don't even count the same thing: one records creation events, the other unique new projects. Put them on one line without saying so and you've invented a drop.
This isn't hypothetical. Earlier in the year, project creation, one of the features we tracked, went from a steady weekly climb to one week that was seventeen times higher than anything before it. Two things had changed on the vendor's side. A few weeks earlier they'd started emitting an explicit event when someone created a project, where before we'd had to infer creation from the first time a project id showed up in the logs. Then, on a single day, they backfilled history, generating a flood of synthetic events for projects that already existed. Our pipeline counted every one of them.
Real weekly shape, counts removed. The grey bars are ordinary life, climbing through the fall and jumping at the start of spring. The red one is a single week where the vendor backfilled historical records. Taken at face value it's a 17x spike. The real semester-start jump was about 2x.
The fix was the same move as always, a second route to the same number. We excluded the backfill, then compared the old first-appearance method against the new explicit events for the weeks where both existed. By the third week they agreed to within about fifteen to twenty percent, which told us the old proxy had been a fair signal all along. The real story was a roughly twofold jump at the start of the spring semester. Still real growth. Just not seventeen-fold.
So the published version said what we saw, said it looked like real deeper engagement, since it was existing users doing more rather than new users arriving, and then said plainly that we were still checking whether anything had changed on the platform side before treating it as a finding. It's a slightly less exciting sentence to put in front of leadership. It's also the sentence that means the next report is still believed.
I built a notebook version of the whole pipeline alongside the dbt models, the same stages in the same order in plain pandas, specifically so I could check the production numbers by a second route. If the notebook and the warehouse ever disagree, one of them has a bug, and you don't get to assume which. That habit comes up in almost every post I write, and it's not a coincidence. I don't trust a number I've only computed one way.
The thing I find genuinely interesting about this work is that it's AI in two directions at once. The subject is AI, how people take up a new kind of tool. But the discipline is completely ordinary data engineering and analysis: clean grains, careful definitions, a second computation path, and suspicion of any chart that tells you exactly what you hoped. The AI part is new. Being wrong about adoption because of a logging change is as old as logging.