The question sounds like something you'd put on a brochure: does what students learn in class line up with what employers actually hire them to do? At a university built around co-op, where students leave for six months to work real jobs in the middle of their degree, it's not a brochure question. It's the whole premise. And for years it was answered with anecdotes, because the evidence lived in two piles of free text that nobody had ever put side by side: job descriptions on one side, course descriptions on the other.
Before any of this, my colleagues Xiao Yang and Gloria John Rumao built a very different system, and it deserves credit up front. They built a model that sorted co-op job postings into sectors. It used GloVe embeddings, which turn words into numbers so that words with similar meanings end up close together, k-means clustering to find natural groups of similar postings, and a semi-supervised random forest, a model that learns from a small set of labeled examples and extends those labels to everything else. It classified more than 60,000 job postings with 85% accuracy. They put it into production in dbt and Snowflake, running every night, and what it showed informed a sector-based restructuring of the job development team. It was amazing to watch. My part was trying BERT-based classifiers alongside it, including SkillBERT, a version of BERT trained on job postings so it understands how skills are written in them. They didn't perform well for us. A lot of the job descriptions simply weren't well written, and we needed a way to quantify what each one was asking for. For that use case, BERT turned out to be less effective than we'd hoped. Then we got access to Snowflake Cortex, Snowflake's built-in LLM functions that you can call straight from SQL, and we went a little wild. We came back to a different question, not which sector a job is in but which skills it asks for, and this time we used an LLM. That's what this post is about.
What changed is that reading free text at scale stopped being a research project. A large language model can take a job description and return a structured list of the skills it asks for. It can do the same for a course description. So the idea we worked from was simple: extract skills from every co-op job description, extract skills from every course, connect each hired student to the courses they'd taken before that co-op term, and measure the overlap. Across the undergraduate hires in the window, that's a little over fifty thousand hiring events, each with its own job and its own course history.
The extraction itself runs inside the warehouse. Snowflake offers LLM functions you can call from SQL, so each posting's text goes to a model with a prompt asking for skills back as JSON, and each skill comes with a category and a confidence score between zero and one. That raw response lands in a table. The first dbt model on top of it does the most unglamorous thing imaginable, it flattens the JSON so that one posting with twenty skills becomes twenty rows, trims whitespace, and drops anything that came back empty or unparseable. Some extractions do come back empty. Some don't parse at all. A pipeline built on an LLM has to treat those as normal, expected rows, not exceptions.
-- one posting with twenty skills becomes twenty rows
select
    src.job_id,
    trim(skill.value:skill::string)   as skill_name,
    skill.value:category::string      as skill_category,
    skill.value:confidence::float     as confidence_score,
    skill.index                       as skill_position
from raw_posting_skills src,
     lateral flatten(input => src.llm_response:skills) skill
where nullif(trim(skill.value:skill::string), '') is not null
The model's raw response looks like {"skills": [{"skill": "SQL", "category": "technical", "confidence": 0.93}, ...]}. Anything that doesn't parse simply produces no rows, which is exactly what you want from a staging model.
Then comes the confidence score, which deserves a little suspicion. It's tempting to read 0.9 as "ninety percent likely to be correct." It isn't. It's the model's own sense of how sure it is, which is useful for ranking but isn't a calibrated probability, meaning nobody checked that the things it calls 0.9 are right nine times out of ten. The pipeline keeps skills at 0.7 and above for matching, which is a reasonable cut, but it's a judgment call, and it's worth saying so rather than presenting it as a statistical threshold.
The real problem shows up next, and it's the part I think people underestimate when they say "just use AI for it." The model extracting skills from a job description and the model extracting skills from a course description don't coordinate. One might say "Python." The other might say "Python programming." A third place, the labor market dataset we use as a reference, calls it "Python (Programming Language)." To a person those are obviously the same skill. To a join, they're three different strings. So there's a normalization step, which maps extracted skills onto a standard taxonomy, a shared vocabulary of canonical skill names. The first version does exact, case-insensitive matching against that taxonomy. Anything that doesn't match exactly keeps its original name and goes into a pile for review. The obvious next step, already noted in the code as a future enhancement, is similarity matching, using embeddings to catch "Python programming" and "Python (Programming Language)" as the same thing even though the strings differ.
| Where it came from | What it said | Exact match? |
|---|---|---|
| Job description | Python | |
| Course description | Python programming | no |
| Reference taxonomy | Python (Programming Language) | no |
| Job description | SQL | |
| Reference taxonomy | SQL (Programming Language) | no |
Illustrative rows. Every "no" in the last column is a skill the student probably has and the metric can't see.
With that in place, the metric is straightforward. For each student and co-op term, take the skills the job asked for and the skills from the courses they'd completed, find the common ones, and divide by the number of course skills. Higher means the student's coursework covered more of what the job wanted.
def alignment_score(job_skills: set[str], course_skills: set[str]) -> float:
    """Share of a student's course skills that the job also asked for."""
    if not course_skills:
        return 0.0
    common = job_skills & course_skills
    return len(common) / len(course_skills)

# a mid-degree student: lots of course skills, one job
alignment_score(
    job_skills={"sql", "python (programming language)", "communication"},
    course_skills={"sql", "python", "statistics", "writing", "communication",
                   "algorithms", "research", "data structures"},
)
# -> 0.25, and "python" vs "python (programming language)" already cost us one
The first result looked alarming. The average alignment score was around four percent. If you took that literally, you'd conclude that courses teach students almost nothing their co-op jobs use, which is a headline, and also almost certainly wrong.
Made-up distribution with the same shape as the real one: bunched near zero, long thin tail. Most of that pile-up is a statement about exact-string matching, not about students.
Look at what the metric actually does. The denominator is every skill extracted from every course the student has taken, which by the middle of a degree is a very large set. The numerator only counts skills that matched exactly, after normalization, between two independent extractions. Any skill that the job called one thing and the course called something slightly different counts as a miss. So a low score is partly a statement about students and partly a statement about the matching, and from the score alone you can't tell how much is which. Before anyone quotes a number like that, the matching has to be good enough that a miss really means a miss.
The skills that did match were revealing in a different way. Across almost every college, the most common matches were Management, Communication and Research. Those show up in nearly every job description and nearly every course description, so they match constantly and mean very little. The interesting signal is further down each list, where it gets specific: Python and SQL and algorithms in computer science, clinical trials and medication reconciliation in health sciences, accounting and finance in business, molecular biology and biochemistry in the sciences. Those are the skills where the overlap actually says something about whether a degree prepared someone for a particular job. A version of this metric that down-weights skills that appear everywhere, the same way a search engine down-weights words like "the", would probably tell a much more honest story than the raw overlap.
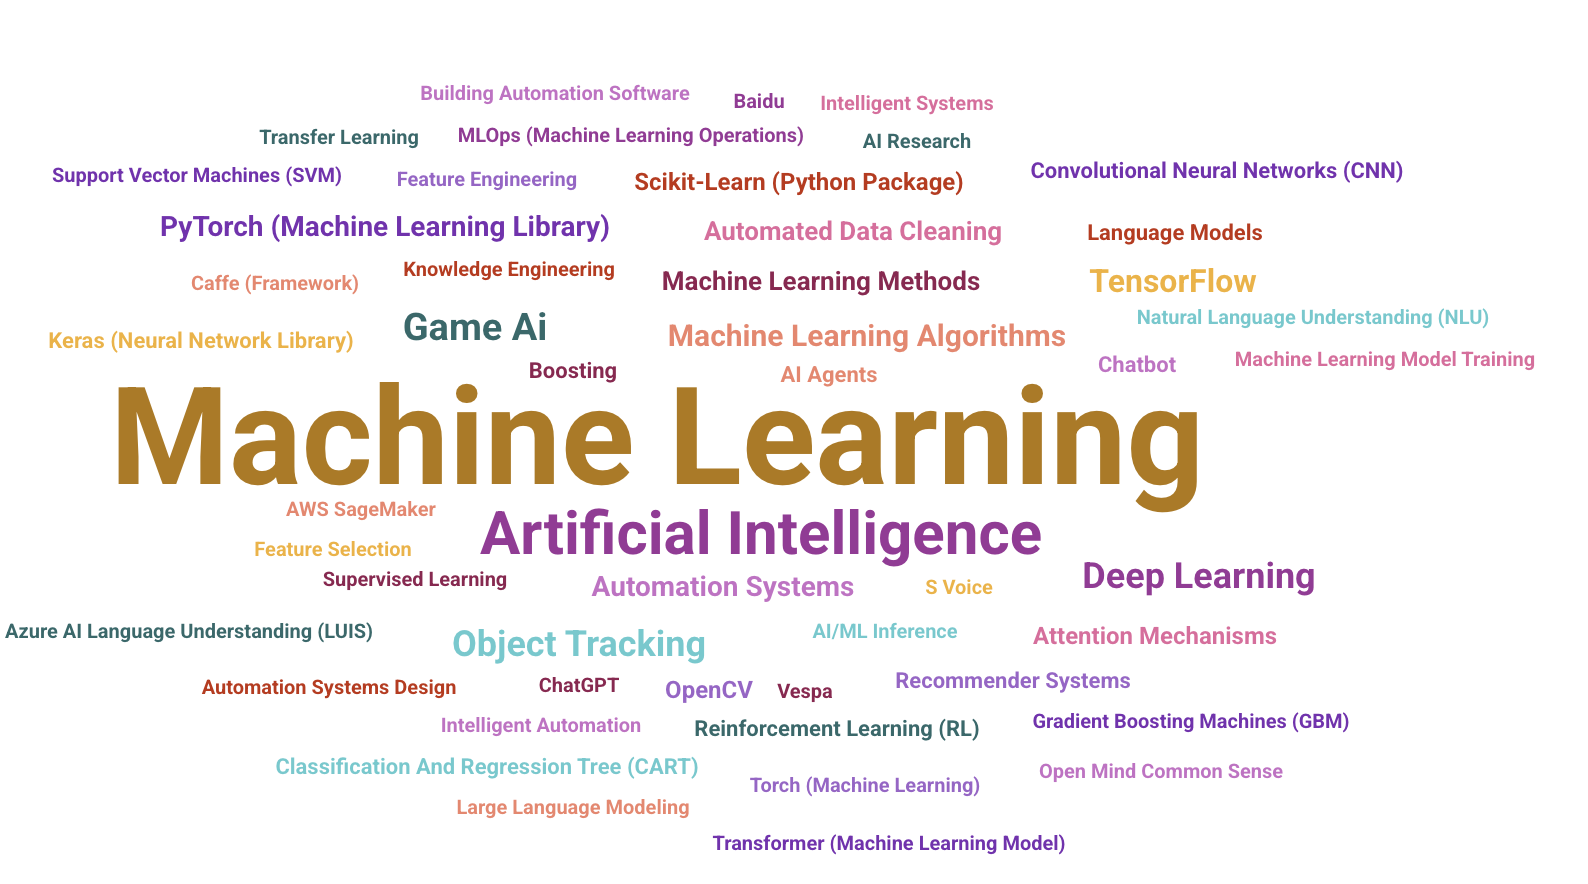
Real extraction output for postings matching AI. Look at how the taxonomy names things: "PyTorch (Machine Learning Library)", "Scikit-Learn (Python Package)", "Keras (Neural Network Library)". A course description that just says PyTorch won't match any of those exactly.
One comparison I was glad to see come out boring: domestic and international students had almost identical alignment distributions. Given how often international students are assumed to land in less relevant roles, flat is a finding worth having.
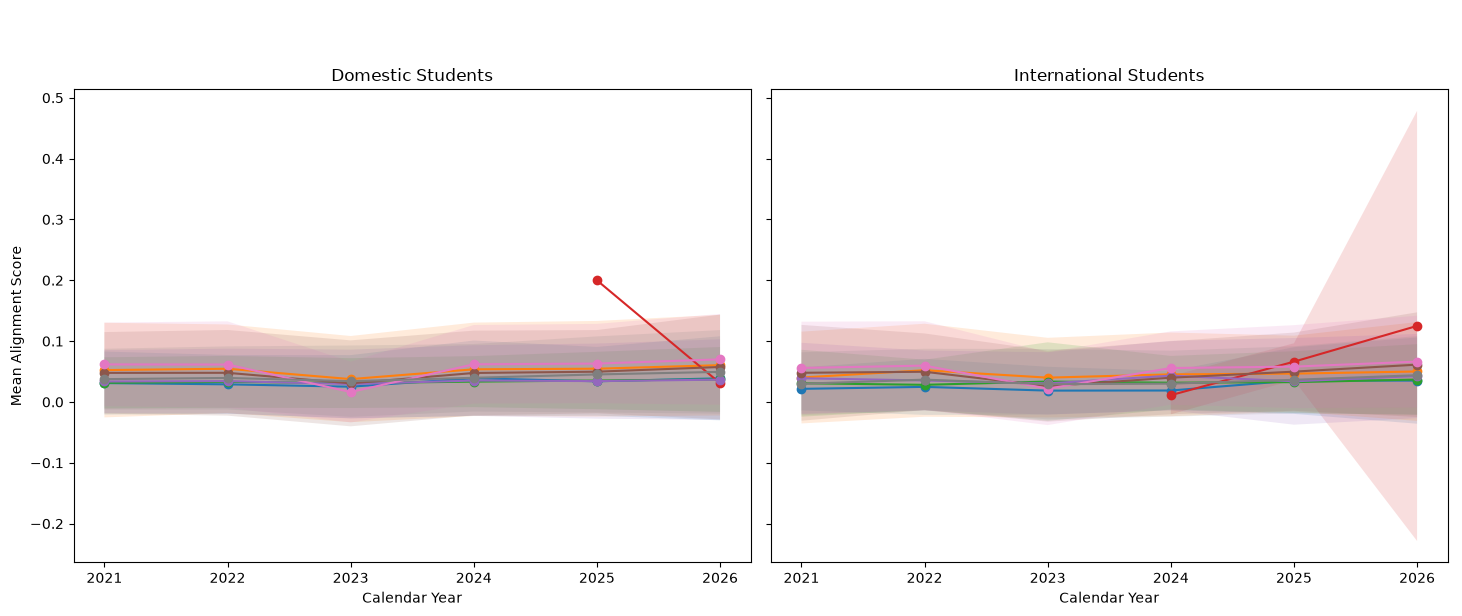
The real chart, with the college legend taken off. Every line sits in the same low band, year after year, on both sides. The two lines that jump around are the smallest groups in the data, which is what small groups do. That huge band on the right is a handful of students, not a trend.
This project is the clearest example I've seen of what working at the intersection of data engineering, data science and AI actually looks like day to day. The AI part, reading text and returning skills, was the part that worked on the first try. The data engineering, flattening responses, handling empty and broken ones, joining students to the right courses before the right term, is what made it a dataset instead of a demo. And the data science, asking what the score actually measures before believing it, is what kept a misleading four percent out of a slide deck. None of the three would have been enough alone.
What comes next for the work is making the matching earn its place: similarity matching for the near-misses, weighting for the skills that appear everywhere, and a sample of matches that a person has actually read and graded, so there's finally something to measure the matching against besides itself.